We want to simplify how you can use Opal to check your focus and screen time throughout the day. @Anton@matt and I have been working on the below design concept:
no more “Score” tab
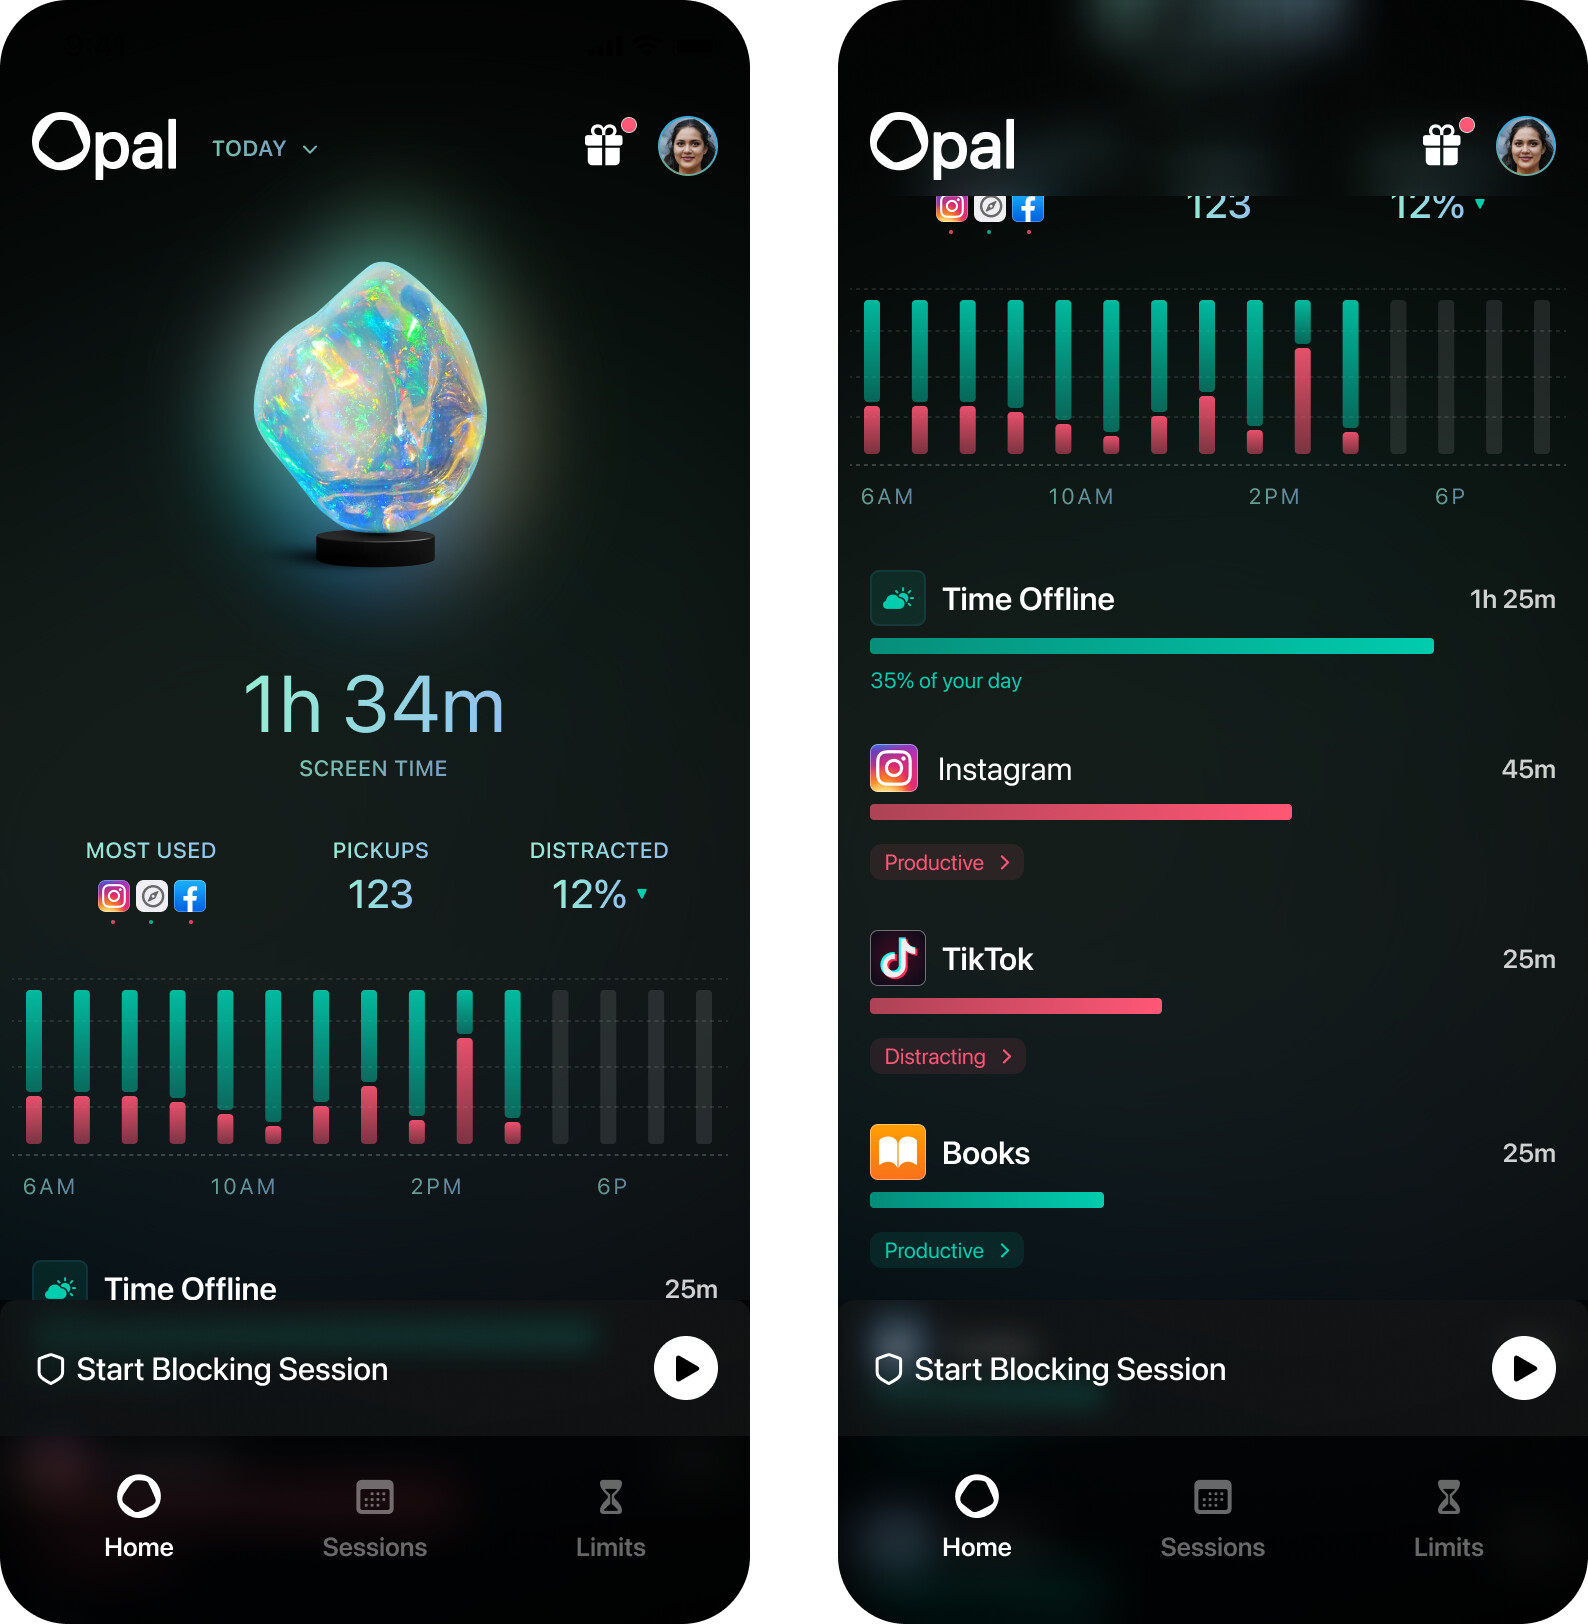
new Home that shows your day up to now as an hourly bar chart, with in green time focused time which includes time you’re offline and screen time on “focused” apps, Vs in red “distracted” screen time.
you can tap and scrub individual bars in the chart to see the data for specific hours
you can see the list of all apps/websites you used, time spent
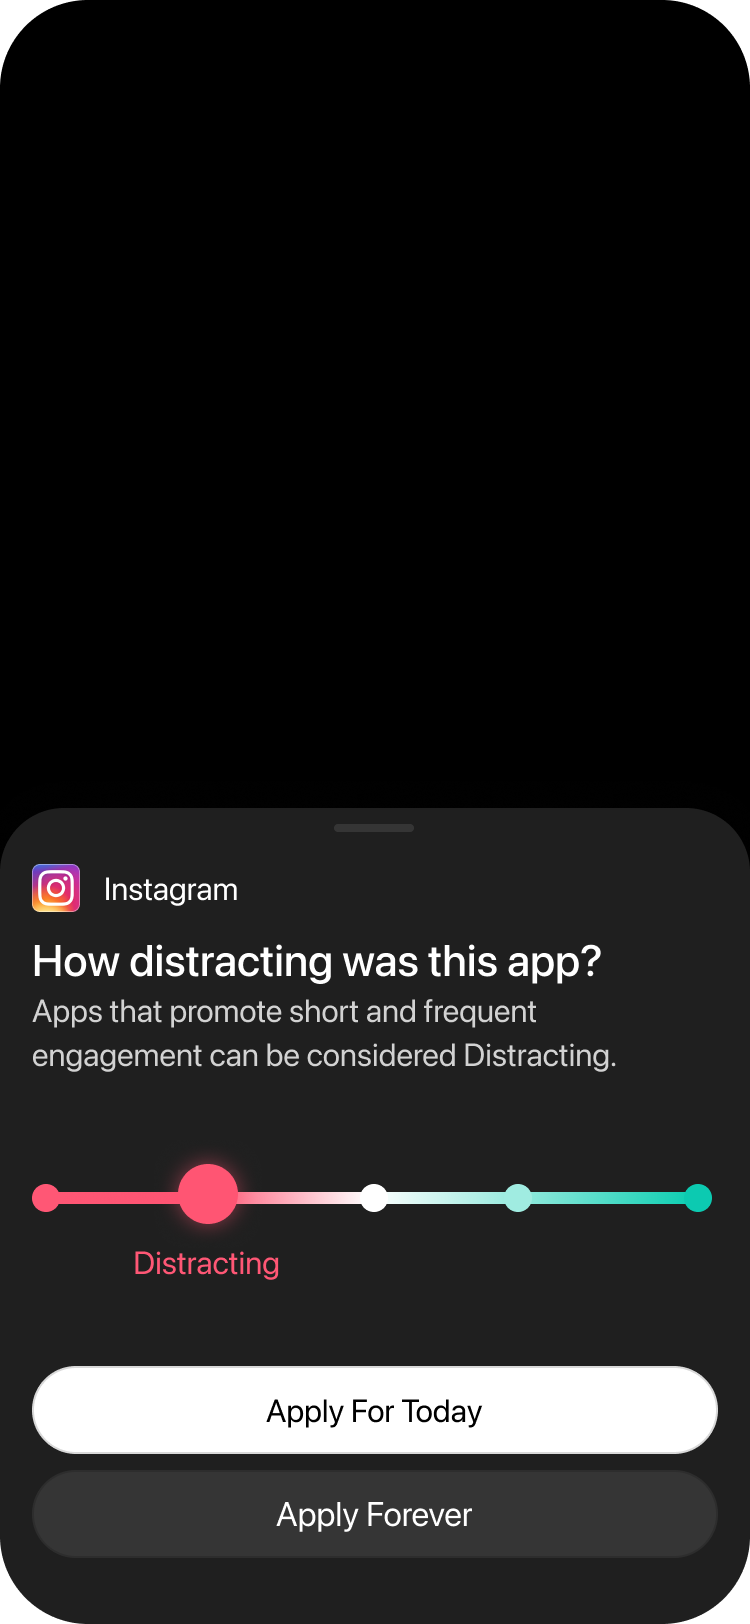
you can tap on any app/website in the list to edit their focus level (“focused”, “distracted”, or neutral where it won’t count in your screen time)
you can tap “today” to pick another date in the past and see the data for that day
Instead of representing your Focus as a numerical value out of 10 (‘focus score’), we show it as a colorful bar chart with red being distracted and green being focused.
5 because it solves my two main issues, which I only shared a couple of days ago so thanks for the reactivity but can be improved of course.
First, I would recommend not showing the “time offline” on the bar graph. The bar graph can show the distracting-apps-time in red, the productive-apps-time in green, and the offline-time just not showing. This way the red and green portions of the bar add up to the total screen-time, so you have an extra piece of graphic information on this graph.
Second, since there is good and bad screen-time, you should differentiate it in the big number shown on the home screen. Beyond the blocking, this is the most important addition of your app to iOS Screen Time: I don’t really care about how much total time I spent on my phone today, I care about how much DISTRACTING time I spent on my phone today. To match the graph (if you implement the change I suggested above), you could simply display the number for the distracting-apps-time in red, and the number for the productive-apps-time in green (or, better, the total screen-time in white).
While you’re at it, add a Y-axis showing some ticks for time, like iOS Screen Time (I recommend showing the 15min, 30min, and 45min marks)
The “% distracted time” is ambiguous. Is this the change relative to the previous hour? To the previous day? To the same hour from the previous day? In any case, I am not convinced this is super relevant at a sub-day level, since our days are organized so that it is expected to have periods of time where we are more distracted than others. This kind of % change is more relevant from day to day, or even more so from week to week, as this is where progress is to be observed.
I liked the qualificatives that went with the focus score (that is, “flow state”, “deep focus”, “distracted”, etc.) so feel free to keep them. This could be useful for very relevant analysis downstream, such as “How many waking hours I spent this week in “deep-focus” or better? How many hours was I “very distracted”?” etc.
Excellent feedback - I agree with all your points! One of the challenges with opal is that the information is not always clear in its relativity and I like how your points address that
I’d rate it a 4. This looks like a really good concept. I just check to see that another app (Speechify) was rated as distracting when I was using it for productive reading, so it would be great to be able to rate how useful/distracting it was this time or for all time. I do feel like the wave in its current iteration is a little more obvious than the video, but maybe it’s just the preview.
I would also like to see either distracted percentage as compared to last week or just see how much of my phone use was productive or distracted.
I miss the score - big part of the appeal for me was the gamified aspect, seeing my score go up and down based on my distraction. I think having the big score first helped me stay accountable so I would like to see that back.
I like the bar chart - the fact it includes non-use time in green is a benefit for me. Unlike the previous commenter, I am definitely trying to get my overall screen time down.
I also think the functionality of the history review has been worsened, I preferred the older scoreboard review style compared to the new one which is harder to toggle between days.
Unfortunately, my score is a 2! I really miss the simplicity of the old numerical score, as I was motivated by the gameified aspect of it and trying to get a better score than the day before.
I also miss how easy it was to look back through previous days.
The gem doesn’t mean that much to me.
How excited are you about this change? From 1-5 where 1 is ‘it’s terrible’, 3 is ‘meeh’ and 5 is ‘it’s the best thing ever’
I’m pretty new but reading this post and comments made me think about one possible idea to help perfectionists like me. It’s basically incorporating a graph indicator used commonly in stock trading called Moving Averages. You can have a 3 Day Moving Average (MA), a 7 Day, a 30 Day and a ‘long term” 90 Day. Basically you can see if over the course of a day (or you could make them weekly moving averages), if ‘on average’ were you performing above average MOST of the time. If you spend at least 51% of your time better than the average of the previous 3/7/30/90 days, then your Moving Average moves up so slightly. Just a thought for including a score or comparative metric in it while keeping the focus on improving.