Copying this over from feedback we received:
I wanted to tell you I’ve really been enjoying Opal. It’s a great product. I was curious if there some way to see stats in a graph showing week over week progress?
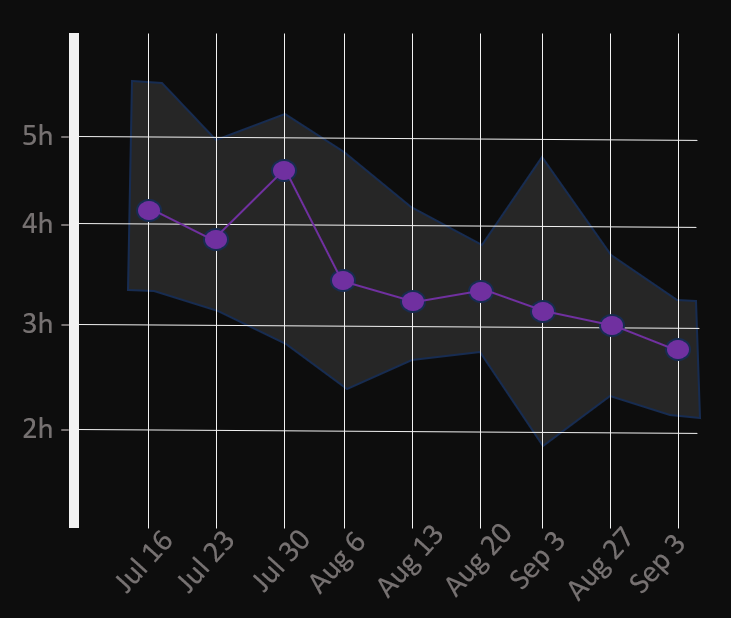
Fwiw app Screentime doesn’t let you (I feel like deloberately) and that would be super valuable to see - your TRENDS with the key behaviors you’re trying to change.
Anyway - thanks for building a great + thoughtful product.