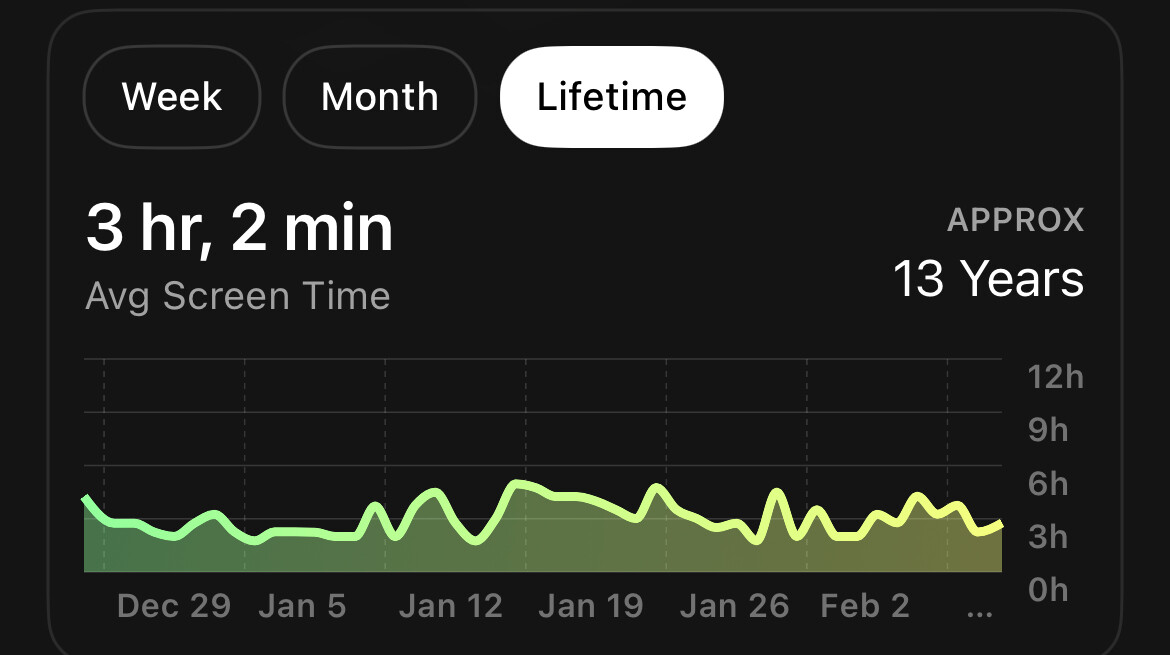
It would be beneficial to refine the formatting of the screen time trend graph in the profile section (displays week, month, lifetime).
The vertical axis scaling is inconvenient— it would be good to scale the graph to the maximum user screen time, not 12hrs. Screen time progress is likely on the scale of minutes per week, which can barely be distinguished on a 12hr axis.
Also, the curve drawn between data points makes a trend difficult to distinguish for the user, as this style of graph visually amplifies noise. Displaying this data as a collection of individual points, or a smoothed curve (showing average time per week, etc) would allow users to see a trend more easily, which is more useful information to the user than a plot of exact screen time.